Autonomy scoreLocal analysis
Norwich Home autonomy potential in Norwich (England)
The strongest asset here is Food growing. It is not, however, what pays your home the most: that is Low-carbon heating.
Annual potential, standard home
£4,435
Four items added up — each one is a separate decision, in whatever order suits you.
Overall score
56 /100
Growing
Norwich: 56/100 achievable autonomy with a recommended setup.
Solid potential — real, achievable gains in energy, water & food autonomy await.
What you could reach in Norwich
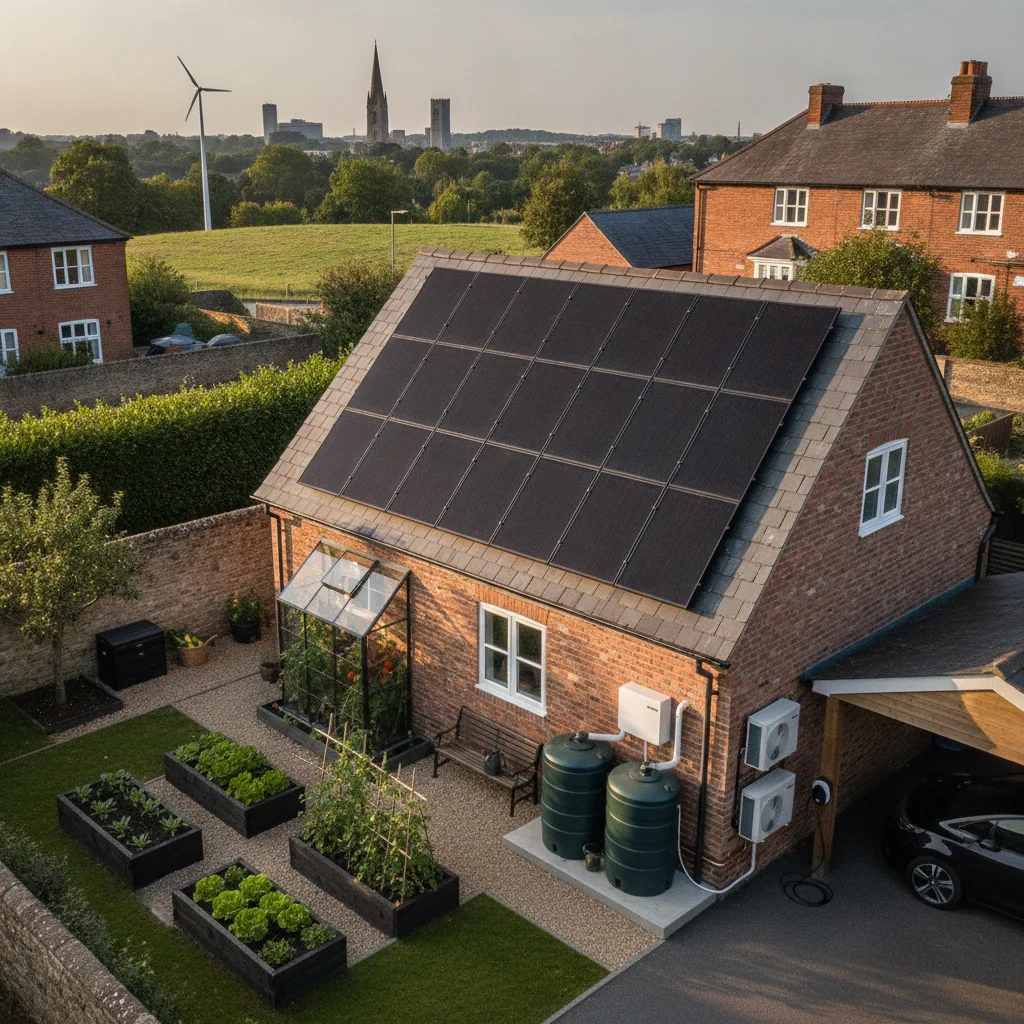
A typical home in Norwich can reach about 56% self-sufficiency with a right-sized solar, storage, rainwater and low-carbon heating setup — much of it backed by UK grants and 0% VAT. The figure sharpens once you enter your own home.
- ≈211 days a year off the grid — keep the fridge, lights, router and heating pump running straight from your own roof and battery, right through a winter outage.
- Rainwater self-reliance — ≈61,625 L harvested from a 100 m² roof covers the garden and toilet flushing, so hosepipe bans stop mattering.
- A real harvest — ≈288 kg of fresh vegetables over a ≈250-day frost-free season takes a genuine bite out of the weekly shop.
- A warm, low-bill winter — insulation plus a right-sized heat pump turns the local climate into low-carbon comfort and shields you from gas-price spikes.
From the most to the least profitable, here
What you could gain
-
Low-carbon heating48/100
~£2,549/yr
less heating after insulation + heat pump (−8,820 kWh/yr on 90 m², electric heating)
The detail
Realistic outlook
2,810 heating-degree-days: a high-efficiency heat pump is the lowest-carbon way to keep Norwich warm.
Watch-outs
A heat pump only pays off in a well-insulated envelope — insulate first, then size the unit.
Grants & tips
Boiler Upgrade Scheme: £7,500 towards an air-source heat pump (England & Wales); ECO4 and the Great British Insulation Scheme fund insulation, plus 0% VAT on heat pumps.
Heating-degree-days (base 18°C) : ≈ 2,810 HDD — Source: PVGIS, hourly ERA5 temperatures 2005–2015 (base 18°C).
-
Food growing67/100
~£847/yr
off the weekly shop — up to ≈288 kg/yr of fresh vegetables from 100 m²
The detail
Realistic outlook
With about 250 frost-free days, a household garden in Norwich supports two planting rotations a year.
Watch-outs
A productive garden needs space, decent soil and a few hours a week — start small and scale up.
Grants & tips
Council allotments (Allotments Act) give cheap growing plots; RHS and community-garden schemes support home food production.
Frost-free growing season : ≈ 250 days — Source: PVGIS, hourly ERA5 temperatures 2005–2015 (frost dates).
-
Solar energy57/100
~£779/yr
less electricity with 3 kWp on your roof (≈3,114 kWh/yr)
The detail
Realistic outlook
At 1,038 kWh/kWp per year, Norwich offers solid potential for residential rooftop solar.
Watch-outs
Roof orientation, shading and DNO connection rules affect real output — get an MCS-certified site assessment first.
Grants & tips
Smart Export Guarantee (SEG): your supplier pays for surplus solar exported to the grid, plus 0% VAT on residential solar PV and battery storage until 2027.
Annual PV yield : 1,038 kWh/kWp — Source: PVGIS 5.2 (EU Joint Research Centre), optimal tilt and local horizon.
-
Rainwater50/100
~£260/yr
less mains water with a 5,000 L tank (≈61,625 L/yr harvestable from a 100 m² roof)
The detail
Realistic outlook
725 mm of rain a year makes rooftop rainwater harvesting worthwhile in Norwich.
Watch-outs
Harvested rain is non-potable by default — keep it separate from drinking water and add a first-flush diverter.
Grants & tips
Many UK water companies offer subsidised or free water butts; on a metered supply, harvested rainwater cuts your water bill directly.
Average annual rainfall : 725 mm — Source: NASA POWER, MERRA-2 corrected precipitation.
£4,435
Ranked by annual value. The order of the works themselves does not change: insulate before you equip.
Estimate for Norwich, based on the area's climate and geographic data. Run the full simulation to get your home's real autonomy score — a personalized result and a detailed plan, in 3 minutes.
Everything is free — score, full report and action plan. No card, no commitment.
Estimate your solar system in Norwich
Estimate your solar system in Norwich
Based on a local yield of 1,038 kWh/kWp per year.
Indicative estimate (production = kWp × local yield). Real output depends on roof orientation, shading and your self-consumption rate.
Climate month by month in Norwich
In Norwich, a 3 kWp array pitched at 41° and facing 4° east of south — the optimum PVGIS computes for this location — produces about 3,114 kWh a year. May is the strongest month, at about 372 kWh, and December the weakest, at 114 kWh. November to February bring 18% of the year's output — enough for a battery to cover winter evenings on sunny days, not through grey spells.
The heating season runs from September to June: 10 months average below 15 °C, and February is the coldest at 4.4 °C. In a typical year the coldest hours drop to about -1 °C, the point a heat pump has to be sized for: a standard air-to-water heat pump copes comfortably in an insulated house.
Frost is possible until late March and returns from late November, which leaves about 250 frost-free days; tender crops such as tomatoes, beans and squash go outside once late March is past. Days above 30 °C are rare, so summer care is mostly steady watering.
Mean wind at 10 m is 4.1 m/s: borderline for a small turbine, which would need an exposed, unobstructed mast to pay off. The southern horizon is open (at most 4.2°) in PVGIS's elevation model, so low winter sun reaches roofs unless nearby buildings block it.
Compared with Luton, 144 km away, Norwich has 1% more solar yield, 27 more frost-free days and a heating need 4% lower. Compared with London, 158 km away, Norwich has 1% more solar yield, 28 more frost-free days and a heating need 3% higher.
| Month | Mean temperature | Solar output, 3 kWp |
|---|---|---|
| January | 4.7 °C | 120 kWh |
| February | 4.4 °C | 165 kWh |
| March | 6.0 °C | 273 kWh |
| April | 8.9 °C | 354 kWh |
| May | 11.8 °C | 372 kWh |
| June | 14.6 °C | 360 kWh |
| July | 17.2 °C | 366 kWh |
| August | 16.7 °C | 339 kWh |
| September | 14.8 °C | 294 kWh |
| October | 12.1 °C | 210 kWh |
| November | 8.0 °C | 147 kWh |
| December | 5.2 °C | 114 kWh |
Frequently asked questions — Norwich
How much could solar panels generate in Norwich?
A well-oriented 3 kWp rooftop array in Norwich produces about 3,114 kWh a year, worth roughly £779 in self-consumption. A 6 kWp system reaches about 6,228 kWh/yr where the roof allows. Smart Export Guarantee (SEG): your supplier pays for surplus solar exported to the grid, plus 0% VAT on residential solar PV and battery storage until 2027.
Is rainwater harvesting worth it in Norwich?
Yes. A 60 m² roof in Norwich can capture about 36,975 litres a year for the garden, WC and washing machine. Keep harvested rain separate from drinking water and fit a first-flush diverter. Many UK water companies offer subsidised or free water butts; on a metered supply, harvested rainwater cuts your water bill directly.
What grants help with low-carbon heating in Norwich?
Boiler Upgrade Scheme: £7,500 towards an air-source heat pump (England & Wales); ECO4 and the Great British Insulation Scheme fund insulation, plus 0% VAT on heat pumps. Insulate first — a heat pump only pays off in a well-insulated home (2,810 heating-degree-days here), so prioritise the roof and walls before sizing the unit.
How much food can a garden grow in Norwich?
With about 250 frost-free days, a 100 m² garden in Norwich yields roughly 288 kg of fresh fruit and vegetables a year — a partial share of a household's needs, not full calorie autonomy. Council allotments (Allotments Act) give cheap growing plots; RHS and community-garden schemes support home food production.
When is the last frost in Norwich?
Frost is possible until late March and returns from late November, which leaves about 250 frost-free days; tender crops such as tomatoes, beans and squash go outside once late March is past.
How much does solar produce in winter in Norwich?
December is the weakest month: a 3 kWp array makes about 114 kWh, against 372 kWh in May. November to February add up to 18% of the yearly total.
How this score is calculated
Public climate data (PVGIS, European Commission) weighted by how vital each dimension is. The score sharpens once you enter your own home. See the full methodology.
Sources
- Solar energy — Source: PVGIS 5.2 (EU Joint Research Centre), optimal tilt and local horizon.
- Rainwater — Source: NASA POWER, MERRA-2 corrected precipitation.
- Food growing — Source: PVGIS, hourly ERA5 temperatures 2005–2015 (frost dates).
- Low-carbon heating — Source: PVGIS, hourly ERA5 temperatures 2005–2015 (base 18°C).
Already ran your simulation?
your score is saved and re-scored every time your home changes. No credit card required.