Autonomy scoreLocal analysis
London Home autonomy potential in London (England)
The strongest asset here is Food growing. It is not, however, what pays your home the most: that is Low-carbon heating.
Annual potential, standard home
£4,247
Four items added up — each one is a separate decision, in whatever order suits you.
Overall score
54 /100
Growing
London: 54/100 achievable autonomy with a recommended setup.
Solid potential — real, achievable gains in energy, water & food autonomy await.
What you could reach in London
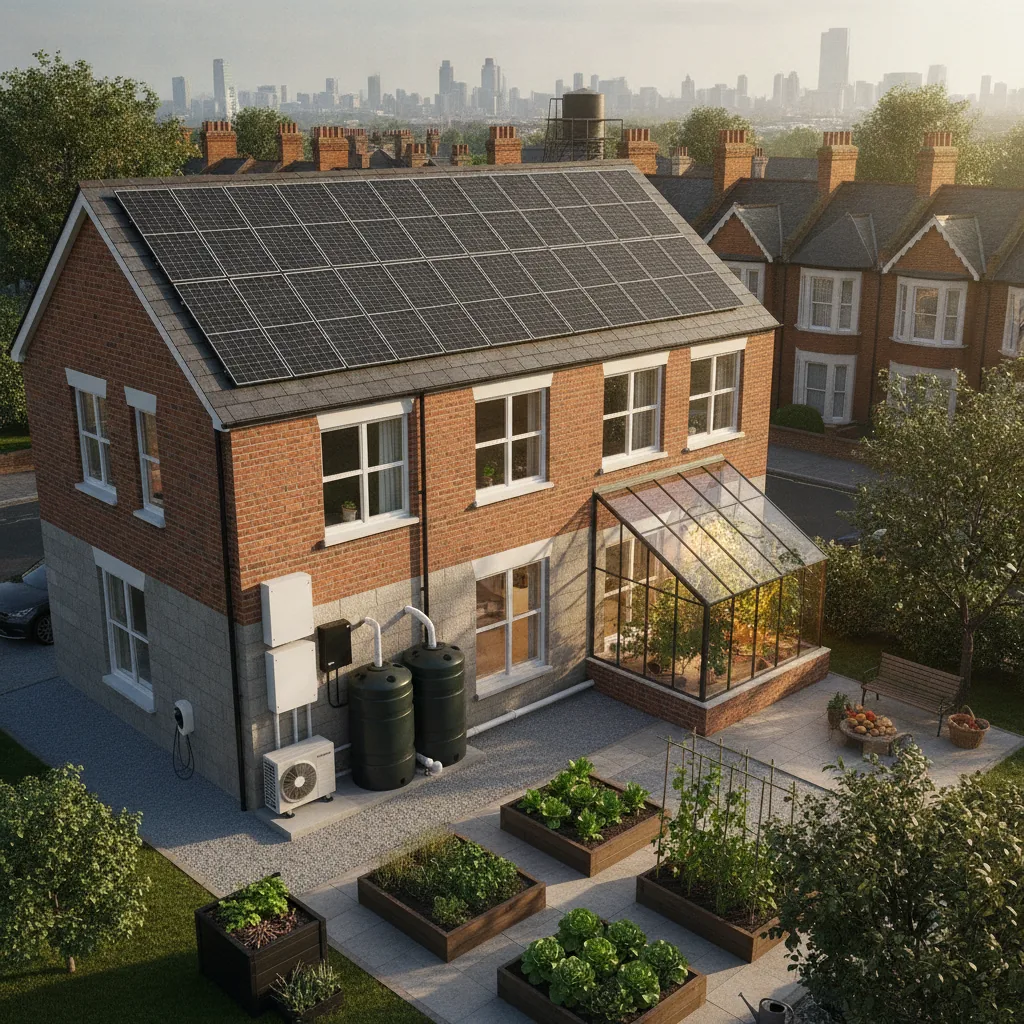
A typical home in London can reach about 54% self-sufficiency with a right-sized solar, storage, rainwater and low-carbon heating setup — much of it backed by UK grants and 0% VAT. The figure sharpens once you enter your own home.
- ≈211 days a year off the grid — keep the fridge, lights, router and heating pump running straight from your own roof and battery, right through a winter outage.
- Rainwater self-reliance — ≈60,350 L harvested from a 100 m² roof covers the garden and toilet flushing, so hosepipe bans stop mattering.
- A real harvest — ≈253 kg of fresh vegetables over a ≈222-day frost-free season takes a genuine bite out of the weekly shop.
- A warm, low-bill winter — insulation plus a right-sized heat pump turns the local climate into low-carbon comfort and shields you from gas-price spikes.
From the most to the least profitable, here
What you could gain
-
Low-carbon heating50/100
~£2,471/yr
less heating after insulation + heat pump (−8,550 kWh/yr on 90 m², electric heating)
The detail
Realistic outlook
2,730 heating-degree-days: a high-efficiency heat pump is the lowest-carbon way to keep London warm.
Watch-outs
A heat pump only pays off in a well-insulated envelope — insulate first, then size the unit.
Grants & tips
Boiler Upgrade Scheme: £7,500 towards an air-source heat pump (England & Wales); ECO4 and the Great British Insulation Scheme fund insulation, plus 0% VAT on heat pumps.
Heating-degree-days (base 18°C) : ≈ 2,730 HDD — Source: PVGIS, hourly ERA5 temperatures 2005–2015 (base 18°C).
-
Solar energy57/100
~£772/yr
less electricity with 3 kWp on your roof (≈3,087 kWh/yr)
The detail
Realistic outlook
At 1,029 kWh/kWp per year, London offers solid potential for residential rooftop solar.
Watch-outs
Roof orientation, shading and DNO connection rules affect real output — get an MCS-certified site assessment first.
Grants & tips
Smart Export Guarantee (SEG): your supplier pays for surplus solar exported to the grid, plus 0% VAT on residential solar PV and battery storage until 2027.
Annual PV yield : 1,029 kWh/kWp — Source: PVGIS 5.2 (EU Joint Research Centre), optimal tilt and local horizon.
-
Food growing58/100
~£744/yr
off the weekly shop — up to ≈253 kg/yr of fresh vegetables from 100 m²
The detail
Realistic outlook
With about 222 frost-free days, a household garden in London supports two planting rotations a year.
Watch-outs
A productive garden needs space, decent soil and a few hours a week — start small and scale up.
Grants & tips
Council allotments (Allotments Act) give cheap growing plots; RHS and community-garden schemes support home food production.
Frost-free growing season : ≈ 222 days — Source: PVGIS, hourly ERA5 temperatures 2005–2015 (frost dates).
-
Rainwater49/100
~£260/yr
less mains water with a 5,000 L tank (≈60,350 L/yr harvestable from a 100 m² roof)
The detail
Realistic outlook
710 mm of rain a year makes rooftop rainwater harvesting worthwhile in London.
Watch-outs
Harvested rain is non-potable by default — keep it separate from drinking water and add a first-flush diverter.
Grants & tips
Many UK water companies offer subsidised or free water butts; on a metered supply, harvested rainwater cuts your water bill directly.
Average annual rainfall : 710 mm — Source: NASA POWER, MERRA-2 corrected precipitation.
£4,247
Ranked by annual value. The order of the works themselves does not change: insulate before you equip.
Estimate for London, based on the area's climate and geographic data. Run the full simulation to get your home's real autonomy score — a personalized result and a detailed plan, in 3 minutes.
Everything is free — score, full report and action plan. No card, no commitment.
Estimate your solar system in London
Estimate your solar system in London
Based on a local yield of 1,029 kWh/kWp per year.
Indicative estimate (production = kWp × local yield). Real output depends on roof orientation, shading and your self-consumption rate.
What is specific to London
Until machine-made bricks spread in the early twentieth century, most London building used yellow, handmade stock brick, often made from brickearth dug on the very fields the houses then covered. Builders commonly halved good bricks so each end showed as a header, leaving fronts poorly tied to the wall behind. These 'snapped headers' can bulge, more so after hard cement repointing, and are worth checking before any facade work. The London Building Act 1774 made terraces carry their party walls above the roofline.
Westminster has 56 conservation areas, and its planning guidance notes that a large share of its buildings are listed or in one. On listed houses it generally accepts solar panels in discreet spots such as an internal valley roof or a flat wall behind a parapet, with listed building consent. Under national rules revised in August 2026, unlisted homes in a conservation area can usually add panels without planning permission, even on the front roof slope, if they are sited to minimise their effect and stand no more than 20cm proud of a pitched roof, but not on a wall fronting a highway. Some areas have Article 4 directions, and Westminster's pre-application advice on such work costs a discounted £408 in 2026/27.
The Pimlico District Heating Undertaking began in 1950 on waste heat from Battersea Power Station piped under the Thames. Now gas-fired, it serves about 3,300 homes and costs £3.5m a year to maintain. In December 2025 Westminster deferred choosing between options including new pipework (£183m) and a river-source heat pump (£211m); a councillors' task group reviewing the programme is due to report later in 2026. Islington's Bunhill heat network built a second energy centre on City Road around a Northern line ventilation shaft, where a heat pump uses warm tunnel air, and connected 550 homes on the King's Square Estate.
Thames Water's hosepipe ban, in force across its supply area since 23 July 2026, was still in place at its 12 October update. Watering cans and water butts are allowed, as is a hose on food crops at home or on an allotment where a can is impractical. Richmond lets residents queue for one allotment site only and reckons a five-rod plot (126 square metres) needs about six hours' care a week. Capital Growth, Sustain's London food-growing network of over 2,000 members, is free to join.
The government's Warm Homes: Local Grant funds insulation, solar panels and heat pumps for lower-income owner-occupiers and private tenants. In London it is delivered by a consortium of 31 boroughs led by the Greater London Authority and London Councils, and the portal reopened in April 2026. Homes must be rated EPC D to G, with household savings under £25,000 and, usually, income of £36,000 or less. Camden warns of people asking residents for £300 to £1,500 to secure applications; no fee is ever due.
Sources
- London stock brick - Wikipedia
- Terraced houses in the United Kingdom - Wikipedia
- Conservation areas - Westminster City Council
- Westminster Environment SPD - Retrofitting and Sustainable Design chapter
- Retrofitting historic buildings - Westminster City Council
- GPDO 2015 Schedule 2 Part 14 (as amended by S.I. 2026/896) - legislation.gov.uk
- Pre-application advice - Westminster City Council
- Pre-application Advice Fees Schedule 2026/27 - Westminster City Council
- Pimlico District Heating Undertaking - Wikipedia
- Westminster City Council delays £200m heat network upgrade - Inside Housing (11 Dec 2025)
- PDHU - Email to residents, 10 June 2026 - Westminster City Council
- Invitation to share your views at a PDHU Task Group meeting (Sept 2026) - Westminster City Council
- Bunhill Heat and Power - Islington Council
- Temporary use ban legal notice - Thames Water
- Temporary use ban (hosepipe ban) - Thames Water
- Hosepipe ban FAQs - Thames Water
- Apply for an allotment - Richmond Council
- About Capital Growth - Sustain
- Warm Homes: Local Grant - Camden Council
- Warm Homes Local Grant - Brent Council
- Apply for the Warm Homes: Local Grant - GOV.UK
Facts checked on 21 October 2026.
Climate month by month in London
In London, a 3 kWp array pitched at 40° and facing 5° east of south — the optimum PVGIS computes for this location — produces about 3,087 kWh a year. July is the strongest month, at about 369 kWh, and December the weakest, at 120 kWh. November to February bring 18% of the year's output — enough for a battery to cover winter evenings on sunny days, not through grey spells.
The heating season runs from September to May: 9 months average below 15 °C, and February is the coldest at 4.4 °C. In a typical year the coldest hours drop to about -3 °C, the point a heat pump has to be sized for: a standard air-to-water heat pump copes comfortably in an insulated house.
Frost is possible until early April and returns from mid-November, which leaves about 222 frost-free days; tender crops such as tomatoes, beans and squash go outside once early April is past. Days above 30 °C are rare, so summer care is mostly steady watering.
With a mean wind of 3.6 m/s at 10 m, a small rooftop turbine would produce little in London; the roof is better used for solar. The southern horizon is open (at most 1.5°) in PVGIS's elevation model, so low winter sun reaches roofs unless nearby buildings block it.
Compared with Luton, 46 km away, London has the same solar yield, 1 fewer frost-free day and a heating need 7% lower. Compared with Reading, 59 km away, London has the same solar yield, 2 more frost-free days and a heating need 2% lower.
| Month | Mean temperature | Solar output, 3 kWp |
|---|---|---|
| January | 4.8 °C | 126 kWh |
| February | 4.4 °C | 165 kWh |
| March | 6.3 °C | 267 kWh |
| April | 9.6 °C | 345 kWh |
| May | 12.4 °C | 360 kWh |
| June | 15.5 °C | 360 kWh |
| July | 17.6 °C | 369 kWh |
| August | 16.8 °C | 327 kWh |
| September | 14.9 °C | 291 kWh |
| October | 12.1 °C | 207 kWh |
| November | 7.9 °C | 150 kWh |
| December | 5.1 °C | 120 kWh |
Frequently asked questions — London
How much could solar panels generate in London?
A well-oriented 3 kWp rooftop array in London produces about 3,087 kWh a year, worth roughly £772 in self-consumption. A 6 kWp system reaches about 6,174 kWh/yr where the roof allows. Smart Export Guarantee (SEG): your supplier pays for surplus solar exported to the grid, plus 0% VAT on residential solar PV and battery storage until 2027.
Is rainwater harvesting worth it in London?
Yes. A 60 m² roof in London can capture about 36,210 litres a year for the garden, WC and washing machine. Keep harvested rain separate from drinking water and fit a first-flush diverter. Many UK water companies offer subsidised or free water butts; on a metered supply, harvested rainwater cuts your water bill directly.
What grants help with low-carbon heating in London?
Boiler Upgrade Scheme: £7,500 towards an air-source heat pump (England & Wales); ECO4 and the Great British Insulation Scheme fund insulation, plus 0% VAT on heat pumps. Insulate first — a heat pump only pays off in a well-insulated home (2,730 heating-degree-days here), so prioritise the roof and walls before sizing the unit.
How much food can a garden grow in London?
With about 222 frost-free days, a 100 m² garden in London yields roughly 253 kg of fresh fruit and vegetables a year — a partial share of a household's needs, not full calorie autonomy. Council allotments (Allotments Act) give cheap growing plots; RHS and community-garden schemes support home food production.
When is the last frost in London?
Frost is possible until early April and returns from mid-November, which leaves about 222 frost-free days; tender crops such as tomatoes, beans and squash go outside once early April is past.
How much does solar produce in winter in London?
December is the weakest month: a 3 kWp array makes about 120 kWh, against 369 kWh in July. November to February add up to 18% of the yearly total.
How this score is calculated
Public climate data (PVGIS, European Commission) weighted by how vital each dimension is. The score sharpens once you enter your own home. See the full methodology.
Sources
- Solar energy — Source: PVGIS 5.2 (EU Joint Research Centre), optimal tilt and local horizon.
- Rainwater — Source: NASA POWER, MERRA-2 corrected precipitation.
- Food growing — Source: PVGIS, hourly ERA5 temperatures 2005–2015 (frost dates).
- Low-carbon heating — Source: PVGIS, hourly ERA5 temperatures 2005–2015 (base 18°C).
Already ran your simulation?
your score is saved and re-scored every time your home changes. No credit card required.